
The Consumer Council, since its first annual supermarket price survey released in 2005 based on the scan data from the 3 major supermarket chains, has expanded for the first time its coverage of major supermarket chains to 4 this year to enable the public a more comprehensive grasp of the trend of supermarket prices.
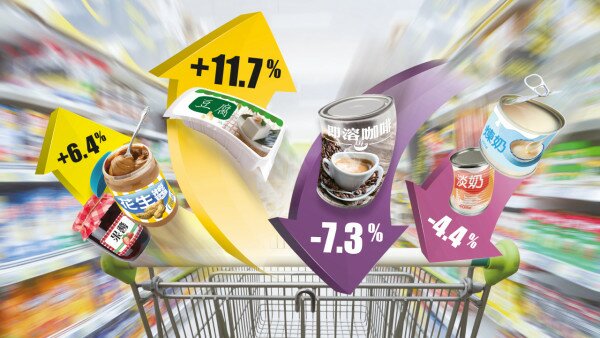
Supermarket prices on a basket of 200 items in 2017 came down a slight 0.04% in aggregate average price compared with the preceding year (2016). But the survey revealed also significant aggregate average price rises in 3 product categories and 15 product groups respectively higher than the increase of Composite Consumer Price Index (CPI) for the corresponding period (1.5%). Prominent among the increases were: the groups of “bean curd” (11.7%), “peanut butter/fruit jam” (6.4%), and “prepackaged cake” (5.9%). In some product groups, the items in the same groups were found to vary in their extent of increase or decrease from over 10% to 20%. Consumers who have no need to buy goods of certain brands, should shop around for price comparison of various brands and different retail outlets to make the best choice.
In the survey, a basket of 200 items were selected from a list of over 1,000 supermarket items of relatively higher sales value for the period between July 2016 and June 2017, broadly divided into 12 categories and sub-divided those into 45 product groups. Despite the slight decline of 0.04% in aggregate average price, 7 categories edged up 0.2% to 5.3%, with the highest increase in the “bread/cake/spread” (5.3%), under which the product groups of “prepackaged bread” and “prepackaged cake” were shown to continue its upward trend for 2 consecutive years in 2016 and 2017. Second in place in highest increase was the category of “dairy food/egg/bean curd” which was up 2%. The biggest price fall (-5.4%) was recorded in the category of “instant beverage”, with “instant coffee” dropping the most (-7.3%).
In terms of product groups, 21 were up 0.4% to 11.7% in their aggregate average prices. Notably, the group of “bean curd” incorporated this year scored the highest increase, 2 of its items were both up in average prices with 1 item rising 17.7%, the highest among all items in the survey and the only product group with a double-digit increase. Included in the same category was also the group of “egg” up 3.7% while the popular group of “ice cream” was up 3%, with 3 items rising 4% to 7.9%. Further, individual items rose sharply in their average prices, including notably a liquid soap product which surged up 21.9% in 2016, again rose a further 12.2% last year.
“Peanut butter/fruit jam” followed next as the second product group in highest price jump, due mainly to a sharp rise of 15.1% in one item, while another item in the same group dropped 2%. The group of “prepackaged cake” came third rising 5.9% on average, with 3 of its items up 1.7% to 8.2%.
The survey also found that average price changes of different products in the same group vary substantially. For instance, the group of “adult milk powder” recorded an aggregate average price increase of 4.6%, but among 3 of its items, 1 item rose 16.1% while the other item came down 5%. Another example was “cheese”. The aggregate average price of this group remained unchanged but among 3 of its items, one was up 10.3% while the 2 others were down 4% and 4.4%.
The survey recorded decreases in aggregate average prices of 5 product categories ranging from 0.7% to 5.4%, with the biggest drop recorded in the category of “instant beverage”. Furthermore, 23 product groups fell in their aggregate average prices from 0.1% to 7.3%. Apart from “instant coffee” recorded the year’s biggest price reduction, the product groups of “evaporated milk/condensed milk” under the same category of “instant beverage” was also down 4.4%, with 2 of the items falling 2.2% and 6.6% respectively.
Though rice remains the main staple food of the locals, the aggregate average price of the “rice” group continued its falling price trend from 5.4% in 2016 (covering 4 items) to 2.8% last year (covering 6 items). Among the 6 rice items, one rose 0.4% in average price while all the remainder 5 slid from 0.2% to 4.7%.
Further, category of “canned food” recorded a decrease of 2.3% in aggregate average price last year. The 3 product groups under it all dropped in their aggregate average prices: “canned vegetable/soup” (-3.6%); “canned meat” (-2.5%) and “canned fish” (-0.6%). All of the 6 items in the group of “canned vegetable/soup” recorded a drop in average selling prices from 1.1% to 12.7%. As for the 5 items in the group of “canned meat”, with the exception of a luncheon meat item up 2.1%, the remainder 4 were on declining price adjustments.
The Consumer Council reserves all its right (including copyright) in respect of CHOICE magazine and Online CHOICE.